Share:

1. COVID-19 Restrictions Result in a Massive Economic Contraction
The outburst of COVID-19 cases in the spring of 2020 lead to a record economic contraction during the second quarter. Lockdown restrictions resulted in high numbers of business closures and layoffs, with consumers unable to travel and patronize in-person stores, hotels, and restaurants. Factories struggled to operate as well, as the pandemic kept their workers at home. As a result, US gross domestic product (GDP) decreased by 9.5% from the prior quarter, the steepest decline in more than 70 years.[1] The impact on the job market was similarly harsh. Following consistent declines in the national unemployment rate since 2009, reaching a low of 3.5% in February 2020, the unemployment rate rose to 4.4% in March and 14.7% in April.[2] US nonfarm payrolls fell by 20.5 million that April, a 13.5% decrease. This was the largest cut to American jobs since 1945, and a job-loss 2.5 times larger than the largest loss in the 2007-2009 great recession.[3] The unemployment rate skyrocketed in both Montana and the Flathead County, to 12.2% and 16.9%, respectively. Given its relatively high proportion of accommodation and food service jobs, the Flathead peaked higher than the national average in May.[4]
[1] US Bureau of Economic Analysis, “GDP.”
[2] US Bureau of Labor Statistics, “UNRATE.”
[3] Dougherty, “Locked Down.”
[4] Figure 1.
2. The Federal Reserve responds by easing monetary policy
Given the unprecedented economic downturn, the Federal Reserve (Fed) used its toolbox of monetary policy to stimulate the economy. In accordance with its core responsibilities of maximum employment and price stability, the Fed sought to keep credit flowing to American households and businesses, encourage more borrowing and spending, and prevent any disruption to financial markets from a sudden unavailability of credit. To accomplish this, the Fed reduced its target for the federal funds rate by 1.5 percentage points in March 2020 to a range between 0% and .25%.[1] The federal funds rate is the short-term interest rate that banks pay to borrow from each other overnight, and it influences longer-term interest rates throughout the economy, such as rates on car loans, credit cards, and homes. This is because banks pass on pass on higher or lower borrowing costs to their customers. By lowering the federal funds rate (fed funds rate), the Fed can indirectly lower those other long-term rates, such as the 30-year fixed rate mortgage (30-year).
The Fed lowered rates to effectively zero once before- about a decade earlier during the financial crisis of 2008. The recession ended in 2009, and as the economy recovered throughout the early 2010s, the Fed began gradually raising the cost of borrowing in 2015 to signal a healthy economy and curb inflation.[2] Between 2015 and 2018, a series of rate hikes brought the fed funds rate to a 2.25%-2.5% range.[3] The 10-year treasury and 30-year mortgage in November 2018 were 3.1% and 4.9%, respectively.[4] Housing prices, after crashing during the great recession, rose throughout the 2010s, leading to a national average home value of $250K in December 2019.[5] Influenced by the Fed’s rate cuts in 2020, the 30-year mortgage fell to 2.67% in December. This was the lowest rate since Freddie Mac began recording rates in 1971.[6]
The Fed offered forward guidance on its policies in September 2020, stating that rates would remain low “until labor market conditions have reached [maximum employment] and inflation has risen to 2 percent and is on track to moderately exceed 2 percent for some time.”[7] Inflation at that moderate level is seen by the Fed as a sign of a healthy economy with ample consumer spending.[8] Accordingly, mortgage rates remained at historically low levels until the Fed announced in December 2021 that it would incrementally raise interest rates throughout 2022 in response to reaching near maximum employment—the highest employment level the Fed deems sustainable—and rising inflation.[9] For example, the 30-year remained below 3% from summer 2020 to fall 2021 compared to levels between 4% and 5% in 2019 and 2018.[10]
[1] Wessel, “What Did the Fed Do in Response to the COVID-19 Crisis?”
[2] “Recession” generally refers to two consecutive quarters of slowing economic growth measured by a decline in GDP. However, the determination of whether the US economy is in recession is subjective and is only officially determined by the National Bureau of Economic Research, an NGO.
[3] Board of Governors of the Federal Reserve System (US), “FEDFUNDS.”
[4] Freddie Mac, “MORTGAGE30US”; “Market Yield on US Treasury Securities at 10-Year Constant Maturity, Quoted on an Investment Basis (DGS10) | FRED | St. Louis Fed.”
[5] Zillow, “United States Home Prices & Home Values.”
[6] Orton, “Fixed Mortgage Rates Tumble to Lowest Levels in History.”
[7] Wessel, “What Did the Fed Do in Response to the COVID-19 Crisis?”
[8] “FRB: What Is an Acceptable Level of Inflation?”
[9] Schneider and Marte, “Fed Signals Three Rate Hikes in the Cards in 2022 as Inflation Fight Begins.”
[10] US Bureau of Labor Statistics, “UNRATE.”, US Bureau of Labor Statistics, “MTFLAT0URN.”
3. Low Rates and Housing Boom
Since the pandemic, the housing market heated to record levels. According to Zillow, the typical single-family home value in the US increased by 13% from $292K in May 2020 to $334K May 2021, and then by 18% to $405K in May 2022.[1] The increase becomes steeper while zooming into Northwest Montana. Statewide, home values jumped 22% from $376K in May 2021 to $479K in May 2022.[2] In Flathead County, the increase was larger at 35% from $536K to $826K.[3] Finally, the strongest increase was in Whitefish, where home values rose 24% from $587K in May 2020 to $773K in May 2021, and by another 38% to $1.3M in May 2022.[4] For comparison, from June of last year, home values increased 22% to $624K in Missoula and 19% to $731K in Bozeman. These trends are visualized in Figure 3.
A combination of factors heated the housing market, the main reason being a high demand and low supply of single-family residences. Record low mortgage rates excited homebuyers and real estate investors, and millions of millennials looked to buy a first home as they entered their early 30s.[5] Additionally, those who kept their jobs in 2020 were able to efficiently save for down payments with stimulus checks, forbearance on student loan payments, and lower travel and entertainment spending.[6] Remote work also enabled workers from urban centers to relocate to Montana and enjoy a higher quality of life with lighter pandemic restrictions and access to the outdoors.
While short-term vacation rentals and remote workers with coastal salaries were blamed for rising home prices, the simplest explanation is the mechanism of supply and demand.[7] Low housing inventory and rising home sales in Kalispell, Missoula, Bozeman, Helena, and Billings—from both in and out of state buyers—resulted in rising home values. There were simply too few homes available for sale relative to the number of would-be buyers.
Insufficient new construction contributed to the supply-demand imbalance. Following the 2007-2009 financial crisis, the construction of new homes in the US dropped significantly. Compared to the 1.7 million single-family unit starts in 2005, only 434,000 homes began construction in 2011. This figure slowly rose over the past decade to 1 million and 1.1 million in 2020 and 2021, respectively.[8] With lower levels of construction since the crisis, there was a shortage of housing going into the pandemic in Montana. The sudden increase in demand—driven by out-of-state buyers, opportunistic investors, a growing population, low rates, and other factors—overwhelmed the existing limited supply and heated the market.[9] For example, Montana’s population increased 10% from 2010 to 2020 while the inventory of housing units only increased by 7% over the same period.[10]
As shown in Figure 4, Kalispell and Missoula saw -40% and -77% changes in available homes for sale, respectively, from summer 2018 to summer 2021. Other key cities in Montana had similar decreases in homes for sale, with the inventory in Bozeman, Helena, and Billings decreasing 73%, 59%, and 75%, respectively.Another key statistic is the months’ supply, which indicates how long the current new for-sale inventory would last at the current pace of home sales assuming no new construction. In July 2021, the national months’ supply of existing homes was 2.6 months and fell even lower to 1.6 months in January 2022. The supply of homes has gradually recovered to three months, which still indicates a hot housing market.[11] With inadequate new construction and falling numbers of homes for sale, the supply of homes could not keep up with the population increase and homebuying frenzy in Montana during the pandemic. Figure 7 shows the population increases for Montana, Flathead County, Kalispell, and Whitefish. The population of Whitefish increased nearly 22% during the past decade, adding 1,394 residents in 2020. Montana and Flathead County grew as well, at rates of 9.6% and 15%, respectively. Flathead county became the fourth largest in Montana as a result, adding 13,400 residents to a total of 104,000.If Kalispell and Whitefish keep growing at their 5-year historical growth rate, the population of each city would more than double by 2032.[12]
[1] Zillow, “United States Home Prices & Home Values.”
[2] Zillow, “Montana Home Prices & Home Values.”
[3] Ibid.
[4] Zillow, “Whitefish MT Home Prices & Home Values | Zillow.”
[5] Friedman, “The Housing Market Is Crazier Than It’s Been Since 2006.”
[6] Ibid.
[7] Dietrich, “Research Says Rising Montana Housing Costs Are Driven by a Home Construction Shortfall.”
[8] US Census Bureau and US Department of Housing and Urban Development, “HOUST1F.”
[9] Brewster, “Montana Housing Market Booming, but Who’s Moving Here?”
[10] Dietrich, “Research Says Rising Montana Housing Costs Are Driven by a Home Construction Shortfall.”
[11] National Association of Realtors, “HOSSUPUSM673N.”
[12] Figure 8.
4. The Federal Reserve responds to inflation by tightening monetary policy
Appreciation in housing prices was only one element of overall inflation over the past year. Inflation, as measured by the consumer price index (CPI), is at a 40-year high and accounts for price increases in a host of consumer goods like homes, cars, groceries, and gasoline.
The CPI rose at an annual rate between 1% and 2% for much of the past decade, but increased sharply during the spring of 2022, reaching 4.2% in April. [1] During May and June, inflation measured 8.6% and 9.1%, respectively. The supply-demand imbalance of homes, as broken down above, was one underlying factor. The primary reason for rising inflation was the growth in consumer demand as COVID-19 subsided. Demand for consumer goods overwhelmed global supply chains which had not recovered from the myriad international lockdowns and other pandemic restrictions. Russia’s invasion of Ukraine and the ensuing Western sanctions further drove up the price of oil, of which Russia is the world’s third largest producer.[2] In response to inflation, the Fed changed course and began to tighten monetary policy; that is, to raise borrowing costs to quell consumer demand. Since March, the Fed raised its target funds rate three times, for a total increase of 1.5 percentage points.[3] Mortgage rates rose as a result of higher inflation and a higher funds rate, with the 30-year jumping from around 3% at the end of 2021 to its current level of 5.54%.[4] The 15-year now sits at 4.75% compared to around 2% a year ago.[5]
[1] Figure 9.
[2] EIA, “What Countries Are the Top Producers and Consumers of Oil?”
[3] Timiraos, “Fed Officials Preparing to Lift Interest Rates by Another 0.75 Percentage Point – WSJ.”
[4] Figure 2.
[5] Ibid.
5. Prospectus for 2023-2025
Forecasting mortgage rates for the coming 2-3 years depends on predicting future economic conditions and assuming how the Federal Reserve will respond based on its policy framework and past behavior. With continued elevated inflation, a tight job market, and solid consumer balance sheets, most experts forecast the Fed to target a 3.25-3.5% interest rate by the end of 2022.[1] First, this assumes a 75bp hike in July, bringing the funds rate to 2.25%-2.5%. The Fed will likely follow up with a 50bp hike in September and 25bp hikes in November and December to bring the funds rate to 3.25%-3.5%.
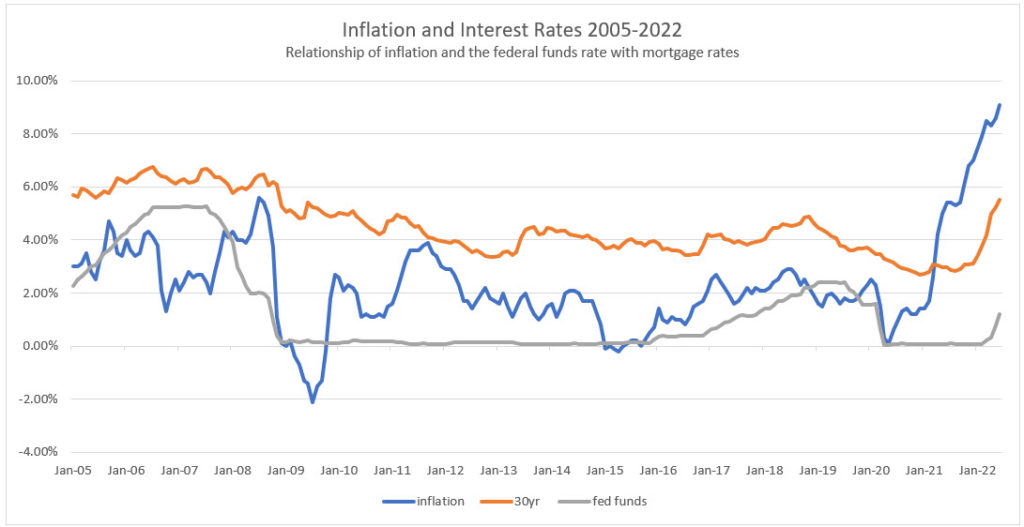
The fed funds rate influences mortgage rates by the ripple effects of changes to short-term borrowing costs, but the Fed does not directly control mortgage rates. Rather, mortgage rates are determined by the price of mortgage-backed securities (MBS), a financial security traded on Wall Street comprised of several loans packaged together.[2] Higher inflation devalues the US dollar, which in turn devalues the cash flows from MBS and makes investors demand higher yields. Thus, inflation is directly tied to changes in mortgage rates, as seen in Figure 9.
Given a four-decade high inflation rate and the Fed signaling several additional rate hikes for 2022, 30-year mortgage rates will likely hover around 5%, with volatility anywhere from a range of 5% to 6.5%, for the remainder of 2022 and at least the first half of 2023.
Base Case (Highest probability)
In my base case assumption, I predict monetary tightening will be successful in lowering inflation to around a 2% level at the end of 2023. The Fed will respond to slowing economic growth and low inflation by targeting a lower fed funds rate at 25bp increments at the beginning of 2024, bringing the funds rate to the often-cited “neutral” level of 2-2.5%. The “neutral” short-term borrowing rate is the accommodative rate for maximum employment and price stability: while the funds rate was much higher in the 1900s and the 2000s, a 2-2.5% rate was considered neutral for the more sluggish economic growth of the 2010s.[3] The 30-year rate will likely fall to around 4%, hovering around that level for 2024-2025. This is supported by the fact that the 30-year rate hovered around 4% from 2012-2019 when inflation remained approximately 2%.[4] The rate will likely approach this level earlier in late 2023 when the Fed begins to signal rate cuts and lower inflationary pressures, which investors will price into the market preemptively.
Recessionary Case (Lowest Probability)
If economic growth slows considerably by mid-2023—or the economy enters a recession— the Fed might be prompted to begin cutting rates by June 2023, targeting the neutral funds rate of 2-2.5% or lower by mid-2023. If inflation has also fallen to a manageable level, the 30-year rate should remain at around the 4% level through 2025. However, recent economic news suggests this case is unlikely. First, while the US economy shrank 1.4% in Q1 2022 off a 6.9% growth rate in the prior fourth quarter, this mostly stemmed from a widening trade deficit.[5] In fact, consumer spending rose at a 2.7% annual rate in Q1, alongside a 9.2% increase in business spending.[6] Furthermore, while inflation shows signs of peaking, the decline in prices will likely be slow.[7] And a commodities price shock—such as a sudden escalation in Ukraine or an outage a key semiconductor or auto plant—could easily push prices to a new high.[8]
Persistent Inflation Case (Moderate Probability)
Financial news outlets jump at any sign the Fed will cut rates earlier, but the profound supply-demand imbalances created by the pandemic and the Russia-Ukraine war will likely keep inflation high. If the Fed’s rate cuts are ineffective at slowing inflation, then the it might be unable to lower short-term borrowing rates until late 2024. In mid-June, a Bloomberg poll of economists found that they expect the Fed to begin cutting rates at the end of 2024 at the earliest.[9] This is also supported by the outcome of the Fed’s response to high inflation (nearly 14%) in the 1980s; it took a series of rate hikes from 1977 to 1981, bringing the funds rate to 19%, for inflation to cool (Figure 10). In this case, the 30-year mortgage could remain in the 5-6.5% range throughout 2023-2024, and only falling in late 2024 to 2025 to the pre-pandemic ~4% level.
[1] Timiraos, “After Fed Raises Interest Rates Wednesday, Investors to Look for Clues About What’s Next.”
[2] “How Mortgage Rates Move When the Federal Reserve Meets.”
[3] Figure 2.
[4] Figure 9.
[5] Cambon, “US GDP Falls 1.4% as Economy Shrinks for First Time Since Early in Pandemic.”
[6] Ibid.
[7] Guilford, “There Are Signs Inflation May Have Peaked, but Can It Come Down Fast Enough?”
[8] Ibid.
[9] “Traders Are Betting Fed Will Cut Rates in 2023 After Steep Hikes.”
Figure 1: Unemployment Rates
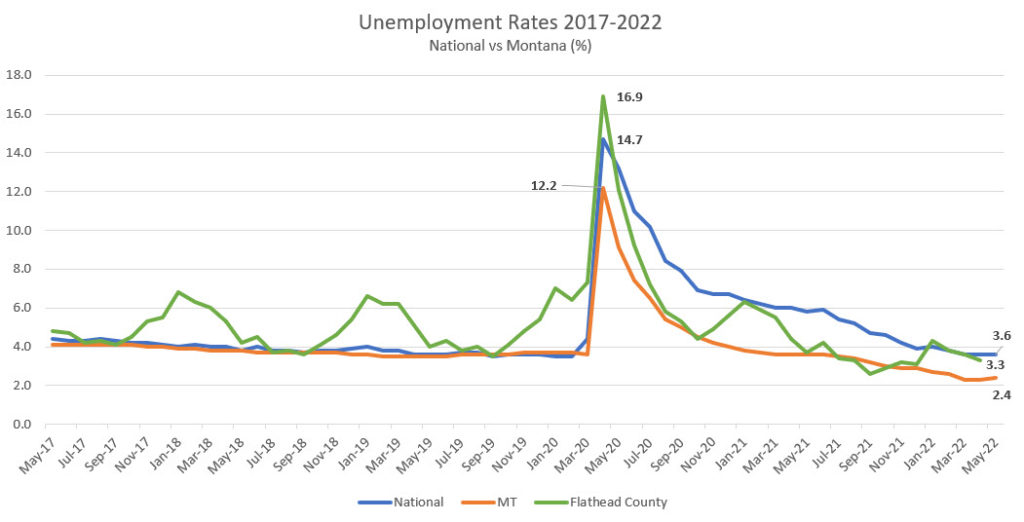
Source: Bureau of Labor Statistics. National and state data is seasonally adjusted; county data is not. This accounts for the fluctuations in the county trend line, where unemployment rises each winter.
Figure 2: Key Interest Rates
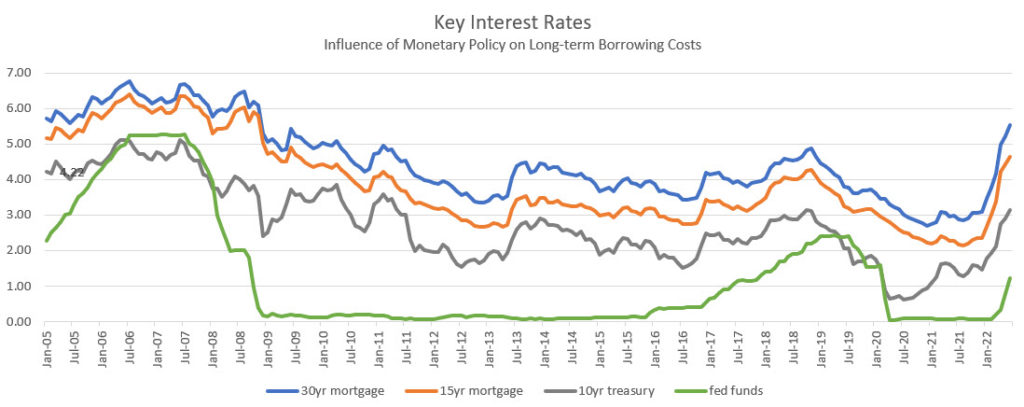
Source: Federal Reserve Bank of Saint Louis (FRED)
Figure 3: Housing Prices
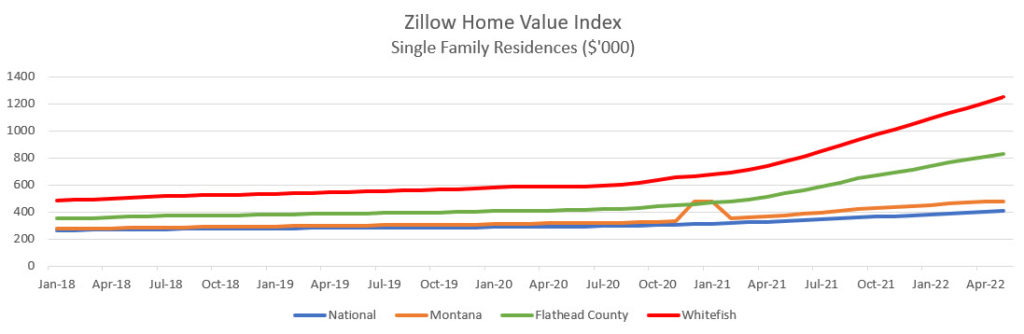
Source: Zillow Research. Each Zillow Home Value Index is a time series tracking the monthly median home value of mid-tier priced homes in a particular geographical region.
| National | Growth | Whitefish | Growth | |||
| May-20 | 292 | May-20 | 587 | |||
| May-21 | 334 | 13% | May-21 | 773 | 24% | |
| May-22 | 405 | 18% | May-22 | 1250 | 38% | |
| Montana | Missoula | |||||
| May-20 | 316 | Jun-21 | 488 | |||
| May-21 | 376 | 16% | Jun-22 | 624 | 22% | |
| May-22 | 479 | 22% | ||||
| Flathead County | Bozeman | |||||
| May-20 | 413 | Jun-21 | 592 | |||
| May-21 | 536 | 23% | Jun-22 | 731 | 19% | |
| May-22 | 826 | 35% |
Figure 4: Montana Housing Inventory
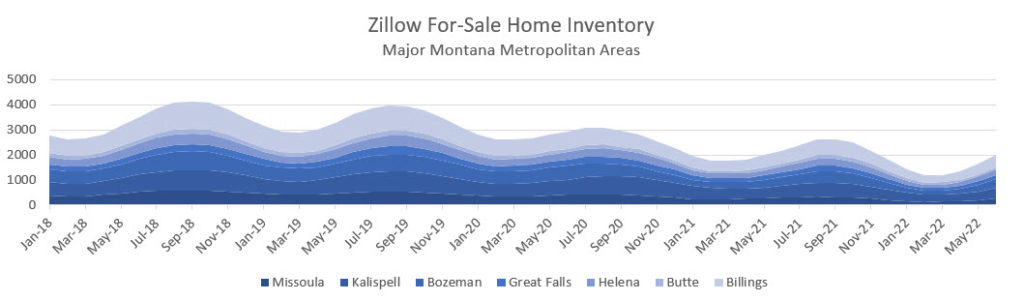
Source: Zillow Research.
| City | Inventory | % Change | City | Inventory | % Change | |
| Missoula | Helena | |||||
| Aug-18 | 579 | Aug-18 | 426 | |||
| Aug-21 | 327 | -77% | Aug-21 | 268 | -59% | |
| Kalispell | Butte | |||||
| Aug-18 | 805 | Aug-18 | 185 | |||
| Aug-21 | 573 | -40% | Aug-21 | 151 | -23% | |
| Bozeman | Billings | |||||
| Aug-18 | 751 | Aug-18 | 1077 | |||
| Aug-21 | 433 | -73% | Aug-21 | 615 | -75% | |
| Great Falls | ||||||
| Aug-18 | 261 | |||||
| Aug-21 | 234 | -12% |
Figure 5: Housing Starts (National)
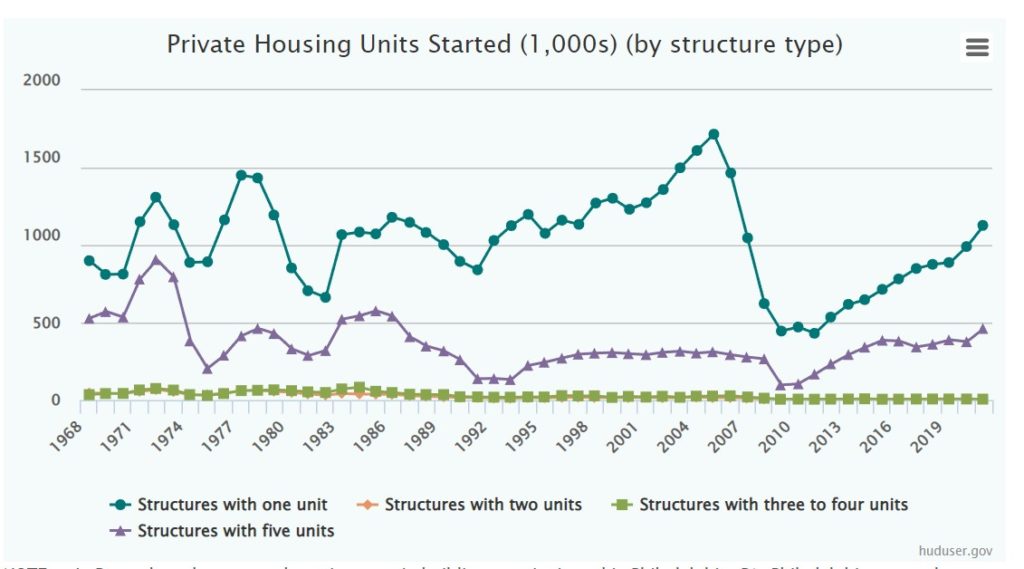
Source: Department of Housing and Urban Development. Single-family residences.
Figure 6: Months’ Supply of Housing (National)
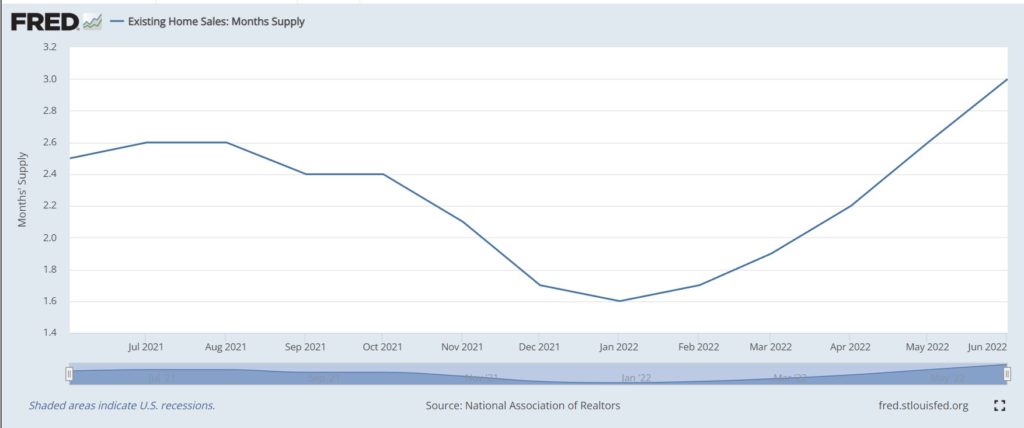
Source: National Association of Realtors. Data accessed from the Federal Reserve Bank of Saint Louis. Existing homes are homes that are owned and occupied before coming onto the market. Months’ supply indicates the number of the months it would take for the current inventory of existing homes on the market to be sold at the current sales pace.
Figure 7: Montana Population Growth
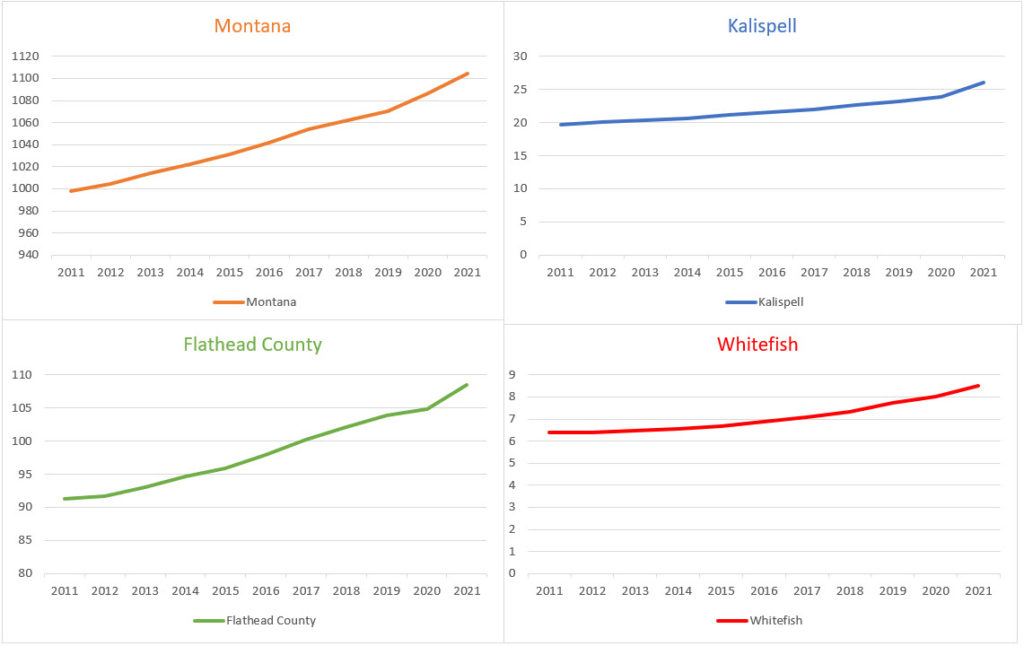
Source: US Census Bureau
Figure 8: Montana 10-year Population Projections
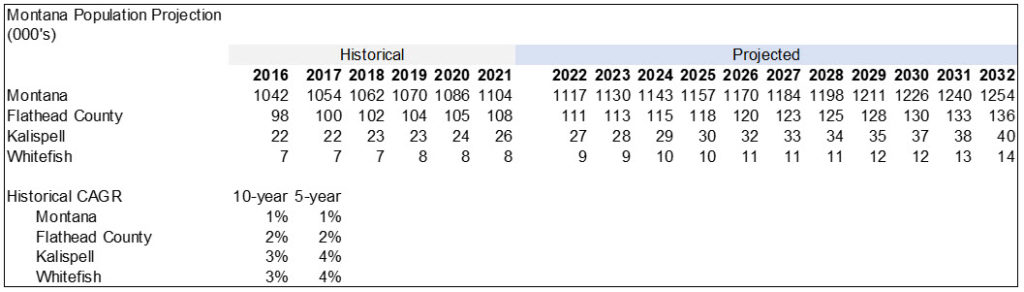
Source: US Census Bureau (historical data). Populations were projected using the 5-year compound annual growth rate (CAGR) applied to the most recent census year (2021). Given recent population booms in Montana, I chose the 5-year CAGR was over the 10-year, which raises the CAGR for Kalispell and Whitefish by 1%.
Figure 9: Macroeconomic Influences on Mortgage Rates
Source: Bureau of Labor Statistics. Inflation is measured as the 12-month percentage change in the Consumer Price Index.
Figure 10: Slow Success of Monetary Policy to Lower Inflation in the 1980s
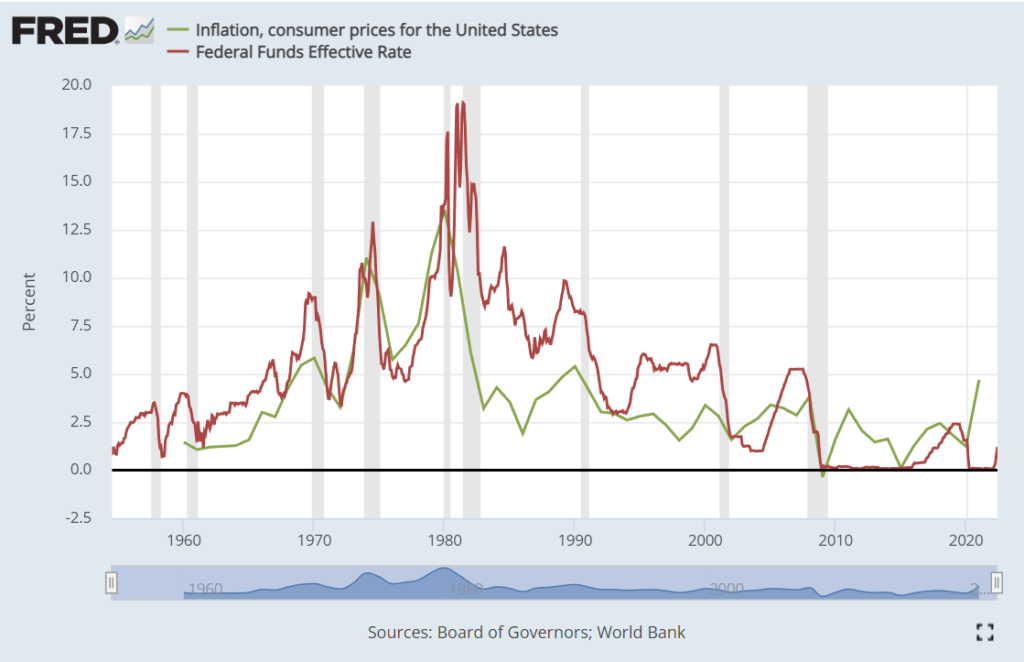
Source: Bureau of Labor Statistics. Data accessed from the Federal Reserve Bank of Saint Louis.
Sources:
Board of Governors of the Federal Reserve System (US). “Federal Funds Effective Rate.” FRED, Federal Reserve Bank of St. Louis. FRED, Federal Reserve Bank of St. Louis, July 1, 1954. https://fred.stlouisfed.org/series/FEDFUNDS.
Brewster, Brady. “Montana Housing Market Booming, but Who’s Moving Here?” KECI, April 14, 2021. https://nbcmontana.com/news/local/montana-housing-market-booming-but-whos-moving-here.
Cambon, Sarah Chaney. “US GDP Falls 1.4% as Economy Shrinks for First Time Since Early in Pandemic.” WSJ. Accessed July 26, 2022. https://www.wsj.com/articles/us-economy-gdp-growth-q1-11651108351.
Dietrich, Eric. “Research Says Rising Montana Housing Costs Are Driven by a Home Construction Shortfall.” Montana Free Press, November 30, 2021. http://montanafreepress.org/2021/11/29/expert-says-montana-home-costs-driven-by-shortage/.
Dougherty, James Benedict, Danny. “Locked Down: How the Coronavirus Drove a Record Rise in Unemployment.” WSJ. Accessed June 22, 2022. https://www.wsj.com/graphics/April-jobs/.
eia. “What Countries Are the Top Producers and Consumers of Oil?” Accessed July 25, 2022. https://www.eia.gov/tools/faqs/faq.php.
“FRB: What Is an Acceptable Level of Inflation?” Accessed July 27, 2022. https://www.federalreserve.gov/faqs/5D58E72F066A4DBDA80BBA659C55F774.htm.
Freddie Mac. “30-Year Fixed Rate Mortgage Average in the United States.” FRED, Federal Reserve Bank of St. Louis. FRED, Federal Reserve Bank of St. Louis, April 2, 1971. https://fred.stlouisfed.org/series/MORTGAGE30US.
Friedman, Nicole. “The Housing Market Is Crazier Than It’s Been Since 2006.” Wall Street Journal, April 3, 2021, sec. Real Estate. https://www.wsj.com/articles/the-housing-market-is-crazier-than-its-been-since-2006-11617422403.
Guilford, Gwynn. “There Are Signs Inflation May Have Peaked, but Can It Come Down Fast Enough?” WSJ. Accessed July 26, 2022. https://www.wsj.com/articles/there-are-signs-inflation-may-have-peaked-but-can-it-come-down-fast-enough-11658568604.
Mortgage Rates, Mortgage News and Strategy : The Mortgage Reports. “How Mortgage Rates Move When the Federal Reserve Meets,” March 15, 2021. https://themortgagereports.com/17724/how-mortgage-rates-move-when-the-federal-reserve-meets.
“Market Yield on US Treasury Securities at 10-Year Constant Maturity, Quoted on an Investment Basis (DGS10) | FRED | St. Louis Fed.” Accessed July 20, 2022. https://fred.stlouisfed.org/series/DGS10.
National Association of Realtors. “Existing Home Sales: Months Supply.” FRED, Federal Reserve Bank of St. Louis. FRED, Federal Reserve Bank of St. Louis, May 1, 2021. https://fred.stlouisfed.org/series/HOSSUPUSM673N.
Orton, Kathy. “Fixed Mortgage Rates Tumble to Lowest Levels in History.” Washington Post, 2020. https://www.washingtonpost.com/business/2020/12/17/fixed-mortgage-rates-tumble-lowest-levels-history/.
Schneider, Howard, and Jonnelle Marte. “Fed Signals Three Rate Hikes in the Cards in 2022 as Inflation Fight Begins.” Reuters, December 15, 2021, sec. US Markets. https://www.reuters.com/markets/us/fed-prepares-stiffen-inflation-response-post-transitory-world-2021-12-15/.
Timiraos, Nick. “After Fed Raises Interest Rates Wednesday, Investors to Look for Clues About What’s Next.” WSJ. Accessed July 26, 2022. https://www.wsj.com/articles/after-fed-raises-interest-rates-wednesday-investors-to-look-for-clues-about-whats-next-11658827800.
———. “Fed Officials Preparing to Lift Interest Rates by Another 0.75 Percentage Point – WSJ.” Accessed July 24, 2022. https://www.wsj.com/articles/fed-officials-preparing-to-lift-interest-rates-by-another-0-75-percentage-point-11658068201.
Bloomberg.com. “Traders Are Betting Fed Will Cut Rates in 2023 After Steep Hikes,” June 14, 2022. https://www.bloomberg.com/news/articles/2022-06-14/traders-and-economists-clash-on-fed-rate-cut-timing.
US Bureau of Economic Analysis. “Gross Domestic Product.” FRED, Federal Reserve Bank of St. Louis. FRED, Federal Reserve Bank of St. Louis, January 1, 1946. https://fred.stlouisfed.org/series/GDP.
US Bureau of Labor Statistics. “Unemployment Rate.” FRED, Federal Reserve Bank of St. Louis. FRED, Federal Reserve Bank of St. Louis, January 1, 1948. https://fred.stlouisfed.org/series/UNRATE.
———. “Unemployment Rate in Flathead County, MT.” FRED, Federal Reserve Bank of St. Louis. FRED, Federal Reserve Bank of St. Louis, January 1, 1990. https://fred.stlouisfed.org/series/MTFLAT0URN.
US Census Bureau and US Department of Housing and Urban Development. “New Privately-Owned Housing Units Started: Single-Family Units.” FRED, Federal Reserve Bank of St. Louis. FRED, Federal Reserve Bank of St. Louis, January 1, 1959. https://fred.stlouisfed.org/series/HOUST1F.
Wessel, Eric Milstein and David. “What Did the Fed Do in Response to the COVID-19 Crisis?” Brookings (blog), December 17, 2021. https://www.brookings.edu/research/fed-response-to-covid19/.
Zillow. “Montana Home Prices & Home Values.” Zillow. Accessed July 7, 2022. https://www.zillow.com/mt/home-values/.
———. “United States Home Prices & Home Values.” Zillow. Accessed July 7, 2022. https://www.zillow.com/home-values/.
———. “Whitefish MT Home Prices & Home Values | Zillow.” Accessed July 7, 2022. https://www.zillow.com/whitefish-mt/home-values/.

Share: